LINK
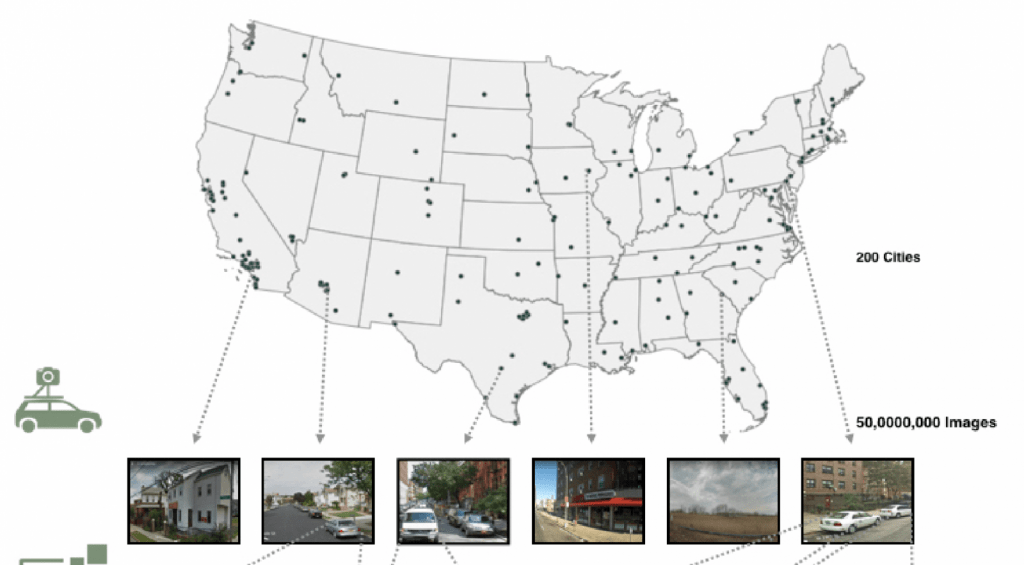
車の写真から車種、年式を推定するモデルをつくった上で、Googleストリートビューの画像を解析. 映り込んでいる車の年式、車種から、その地域の人種的な構成や投票傾向などを推定しようとする試み.
たとえば、ストリートビュー内での15分のドライブに相当する移動の中で、ピックアップトラックとセダン、どちらに出会う回数が多いかをカウントすることで、その地域が大統領選挙で民主党・共和党のどちらに票が集まったのか、80%を超える精度で当てることができた、といいます。(セダンが多い = 民主党、ピックアップトラック = 共和党)
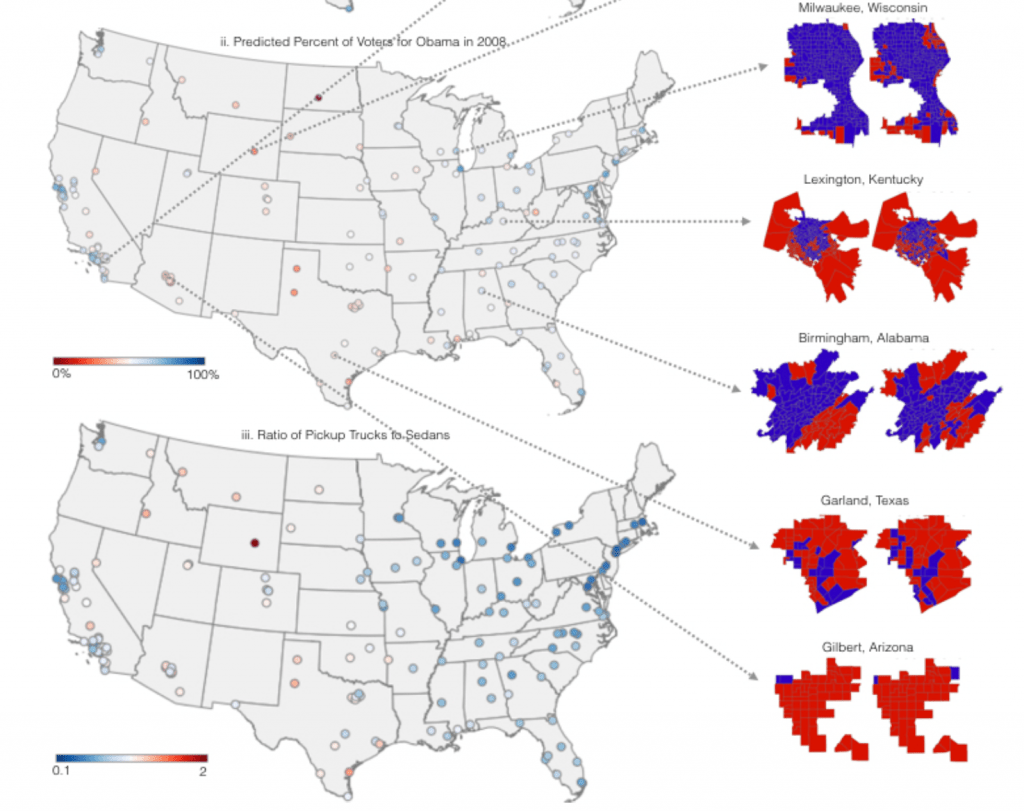
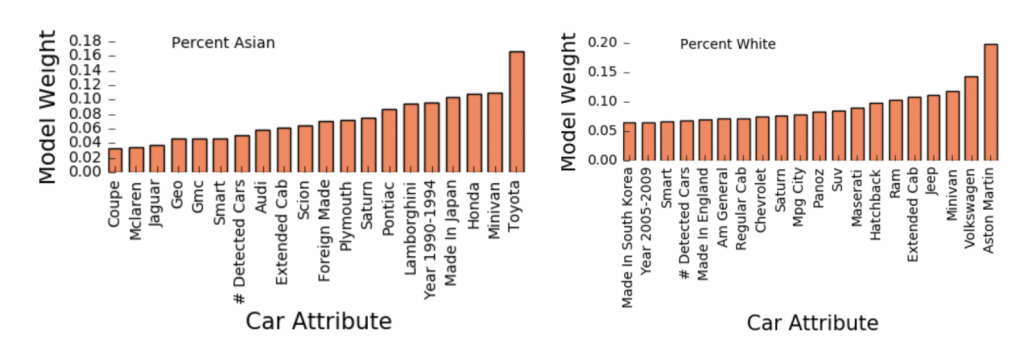
そのほか、国勢調査の結果をもとに、地域の人種的な偏りと所有されている車種の関係を学習. 選挙同様に、ストリートビューの車から、地域の人種的な偏りを推定する、なんてこともやってます.
トランプ大統領の誕生によって社会の分断が顕著な現代アメリカを象徴するようなデータです. まるでメディアアートの作品のようだと思いませんか.
日本のように人口が密集している上に、デモグラフィックな差がアメリカほど大きくない国で同じことをやったときにどのような結果が出るのか興味深いところです. 別の用途で集めた公開データを、機械的に大量に解析することでその裏に隠れた有用なデータを導き出す、という意味で参考になるプロジェクトではないでしょうか.
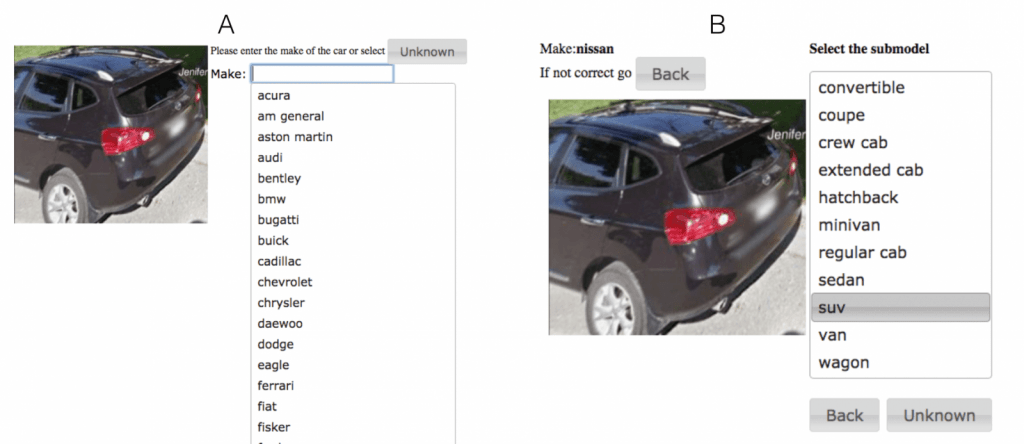
なお、車種を推定するモデルを学習するためのデータは、Amazon Mechanical Turkで人力でデータを集めたそうです.
arXiv(2017.02.02公開)The United States spends more than $1B each year on initiatives such as the American Community Survey (ACS), a labor-intensive door-to-door study that measures statistics relating to race, gender, education, occupation, unemployment, and other demographic factors. Although a comprehensive source of data, the lag between demographic changes and their appearance in the ACS can exceed half a decade. As digital imagery becomes ubiquitous and machine vision techniques improve, automated data analysis may provide a cheaper and faster alternative. Here, we present a method that determines socioeconomic trends from 50 million images of street scenes, gathered in 200 American cities by Google Street View cars. Using deep learning-based computer vision techniques, we determined the make, model, and year of all motor vehicles encountered in particular neighborhoods. Data from this census of motor vehicles, which enumerated 22M automobiles in total (8% of all automobiles in the US), was used to accurately estimate income, race, education, and voting patterns, with single-precinct resolution. (The average US precinct contains approximately 1000 people.) The resulting associations are surprisingly simple and powerful. For instance, if the number of sedans encountered during a 15-minute drive through a city is higher than the number of pickup trucks, the city is likely to vote for a Democrat during the next Presidential election (88% chance); otherwise, it is likely to vote Republican (82%). Our results suggest that automated systems for monitoring demographic trends may effectively complement labor-intensive approaches, with the potential to detect trends with fine spatial resolution, in close to real time.