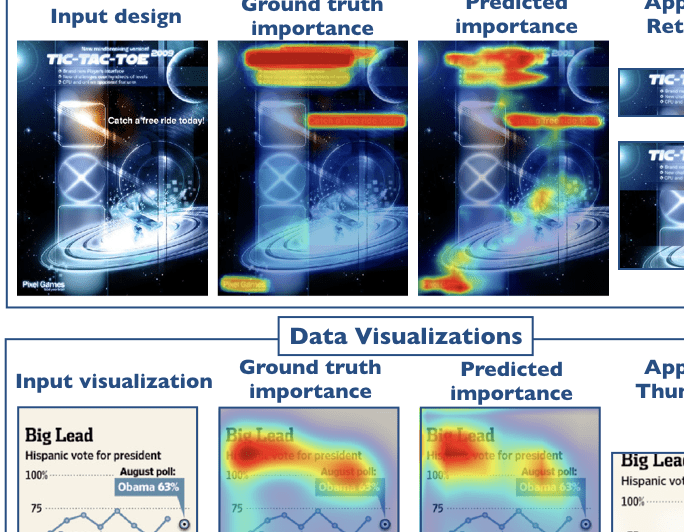
グラフィックデザインやデータビジュアライゼーションを見るときに、人はどこに注目するのか. クラウドソーシングで集めたデータなどから、画面上の各要素の注目度を予測するモデルをつくったというものです。
インタラクティブにテキストや画像といった要素を足していって、それぞれの重要度がどのように変わるのかを見ることができるのも面白いですね。 モデルにはFully Convolutional Neural Network (FCN)が使われています.
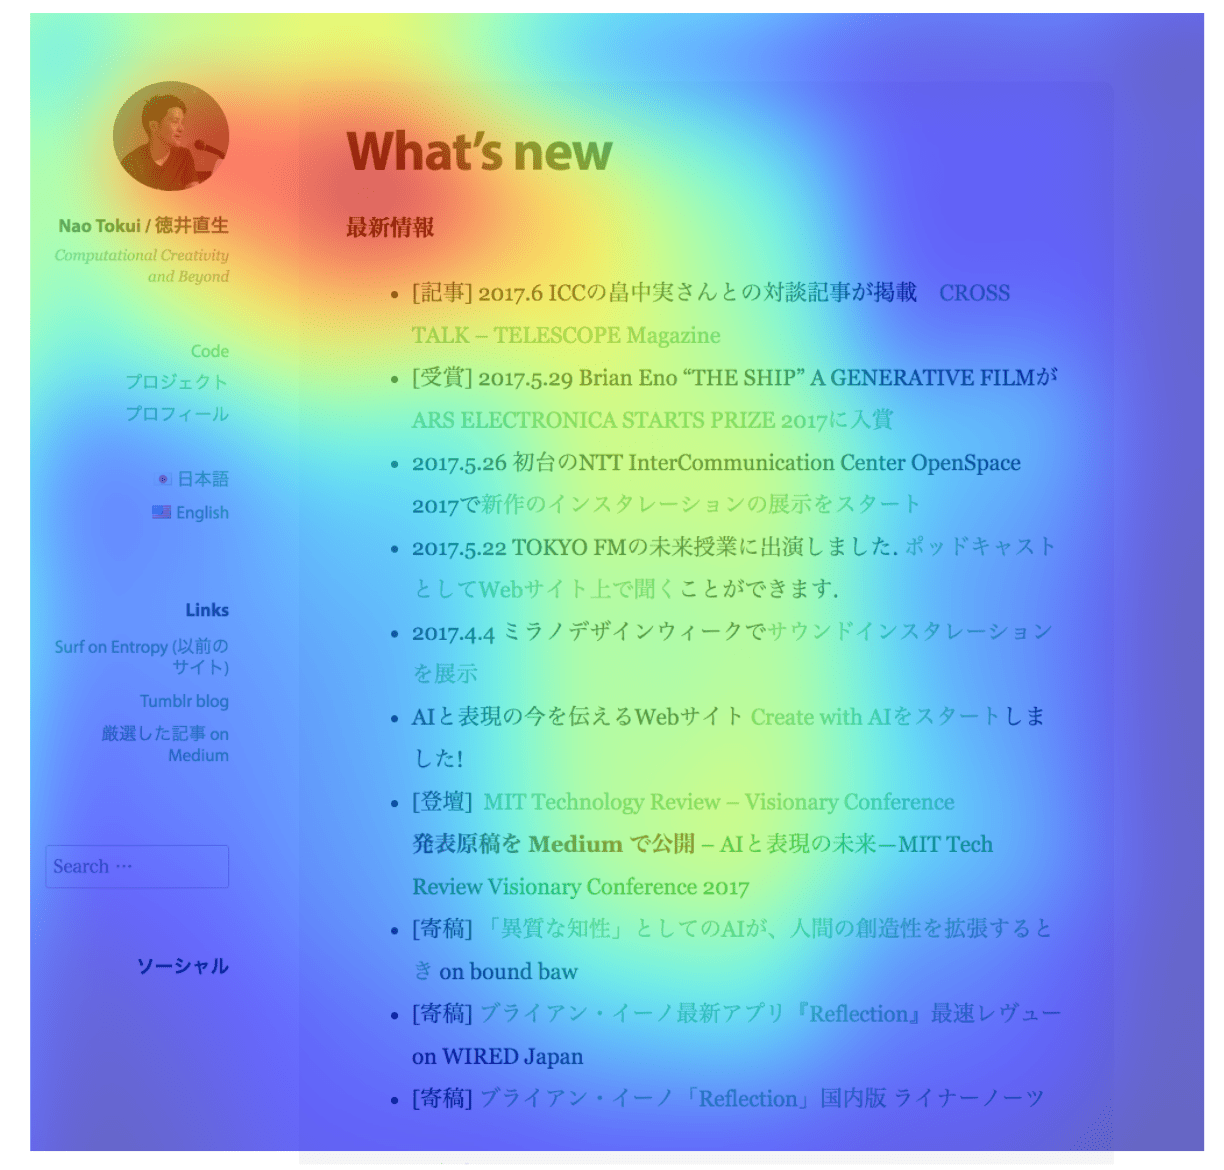
ちなみに自分のWebサイトで試したところ、こんな結果に。左のメニューが見事に見落とされています。メニューが見にくいのは前から気になっていたのですが、見事にその直感が裏付けされた形です。
Webやアプリ用に、わかりやすいUIを作りたい!といった場合に参考になりそうですが、ここで挙げられているのはあくまでも「セオリー」ですよね。AIが伝えるセオリーの通りにデザインするのか、それともあえてそれを破るのか。デザイナー側の意思決定が求められることになりそうです。
Knowing where people look and click on visual designs can provide clues about how the designs are perceived, and where the most important or relevant content lies. The most important content of a visual design can be used for effective summarization or to facilitate retrieval from a database. We present automated models that predict the relative importance of different elements in data visualizations and graphic designs. Our models are neural networks trained on human clicks and importance annotations on hundreds of designs. We collected a new dataset of crowdsourced importance, and analyzed the predictions of our models with respect to ground truth importance and human eye movements. We demonstrate how such predictions of importance can be used for automatic design retargeting and thumbnailing. User studies with hundreds of MTurk participants validate that, with limited post-processing, our importance-driven applications are on par with, or outperform, current state-of-the-art methods, including natural image saliency. We also provide a demonstration of how our importance predictions can be built into interactive design tools to offer immediate feedback during the design process.